Pie or donut with custom legend
The code for this example can be used in the Markdown visualization to create a pie or donut chart with a customized legend.

Setup
Use this sample dataset and code to recreate this example in your own instance.
- Download the sample CSV.
- Upload the sample CSV to your instance. Refer to the Data input tables guide for instructions.
- In a new query tab, select all the dimensions. Every field except
Pie Count
should be selected when you're finished. - On the Results tab, open the Options panel and enable column totals.
- In the
Session Count
totals cell, click the ... menu and select Total Calculation > Sum. - Format the
Percent Of Total
column to percentage and adjust the decimal places to your liking.
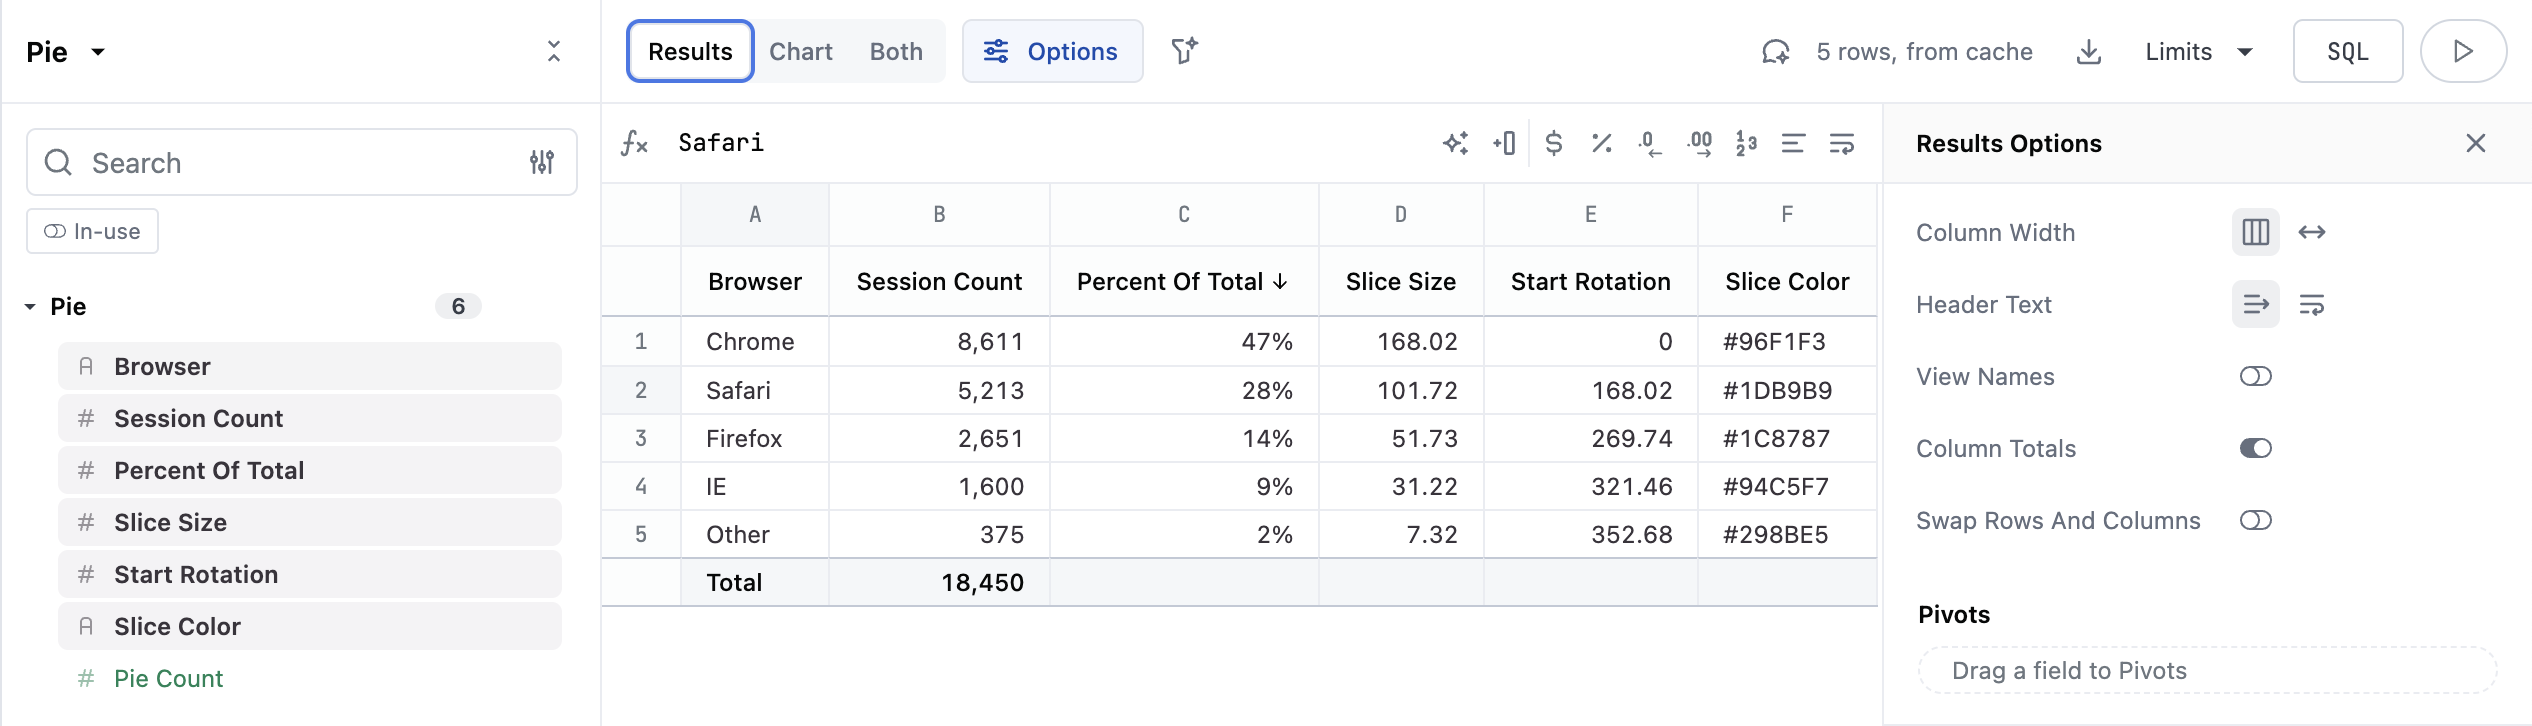
Your query should look like this:

Note: To recreate this with your own data set, you'll need to create calculations for Percent of Total
, Slice Size
, and Start Rotation
. These formulas reference the columns as they are in the above screenshot:
Percent of Total
-=B1 / SUM(B:B)
Slice Size
-=B1 / SUM(B:B) * 360 // or Percent of Total * 360
Start Rotation
-=SUM(D$1:D1)
// The sum of all the previous values ofSlice Size
- if you are copying this formula, enter it on the second row to get it to apply correctly
You can now click Chart and select the Markdown chart type. Copy and paste the sample code below into the markdown editor.
Example code
<style>
.pie-card {
/* ----- variables to customize ----- */
--chart-size: 200px; /* diameter of the pie */
--hole-color: var(--color-background); /* color of the donut hole, if used */
--hole-width-ratio: .5; /* 0 to 1 for size of donut hole: 0=pie, 0.9 is a very skinny donut */
width: 100%;
height: 100%;
display: grid;
grid-template-columns: var(--chart-size) 1fr;
gap: var(--size8);
}
.pie {
--hole-size: calc(var(--chart-size) * var(--hole-width-ratio));
width: var(--chart-size);
height: var(--chart-size);
position: relative;
list-style: none;
margin: 0;
padding: 0;
& .center {
border-radius: 50%;
position: absolute;
top: 50%;
left: 50%;
transform: translate(-50%, -50%);
}
& .fill {
width: var(--chart-size);
height: var(--chart-size);
}
& .mask {
background-color: var(--hole-color);
width: var(--hole-size);
height: var(--hole-size);
}
& .title {
font-size: var(--font-lg);
}
}
.pie-legend {
display: flex;
flex-direction: column;
gap: var(--size6);
& ul, & li {
margin: 0;
padding: 0;
list-style: none;
}
& ul {
display: grid;
grid-template-columns: 1fr 1fr 1fr;
gap: var(--size4);
}
& h2, & h3 {
margin: 0;
padding: 0;
display: flex;
gap: 0;
flex-direction: column;
font-weight: normal;
}
& h2 {
font-size: var(--font-lg);
& .pie-label {
font-size: var(--font-sm);
line-height: var(--line-height-sm);
color: var(--color-text2);
}
}
& h3 {
font-size: var(--font-md);
border-left-width: 4px;
border-left-style: solid;
padding-left: var(--size3);
& .pie-label {
font-size: var(--font-xs);
line-height: var(--line-height-xs);
color: var(--color-text2);
& .pie-percent {
opacity: 0.5;
}
}
}
}
</style>
<article class="pie-card">
<ul class="pie">
{{#result}}
<li class="center fill" style="background-image: conic-gradient(from {{pie.start_rotation.value_static}}deg, {{pie.slice_color.value_static}} {{pie.slice_size.value_static}}deg, transparent 0)"></li>
{{/result}}
<li class="center mask"></li>
</ul>
<div class="pie-legend">
<h2><span class="pie-value">{{result._totals._first.pie.session_count.value}}</span><span class="pie-label">Total sessions</span></h2>
<ul>
{{#result}}
<li><h3 style="border-left-color: {{pie.slice_color.value_static}}"><span class="pie-value">{{pie.session_count.value}}</span><span class="pie-label">{{pie.browser.value}} <span class="pie-percent">• {{pie.percent_of_total.value}}</span></span></h3></li>
{{/result}}
</ul>
</div>
</article>