Example code
<div style="display:flex; align-items: center; justify-content:center; flex-direction: column;">
<div style="display:flex; align-items: center;flex-direction:column;">
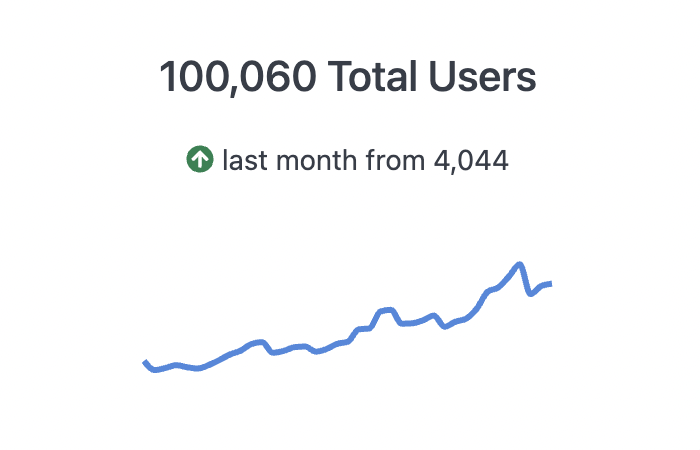
###**{{result._first.users.count.value}}** Users this Month
<p style="font-size: var(--font-sm);"> <ChangeArrow current="{{result.0.users.count.value_static}}" comparison="{{result.1.users.count.value_static}}"></ChangeArrow> last month from {{result.1.users.count.value}}
</p>
</div>
<Sparkline field="users.count" color="#4889DE" height=50% width=70% reverse=true></Sparkline>
</div>