Honeycomb categorical chart
The code for this example can be used in the Markdown visualization to create a hexagonal grid with a label and value in each cell. Cells are colored by a categorical value, in this case by the gender majority per age. This chart uses the Mustache iterator syntax to draw a shape for each row in the results.

Setup
Your query should have a dimension that determines the number of hexagons, their labels and some way to determine color. The following table explains each field used in the example, including the calculation formulas.

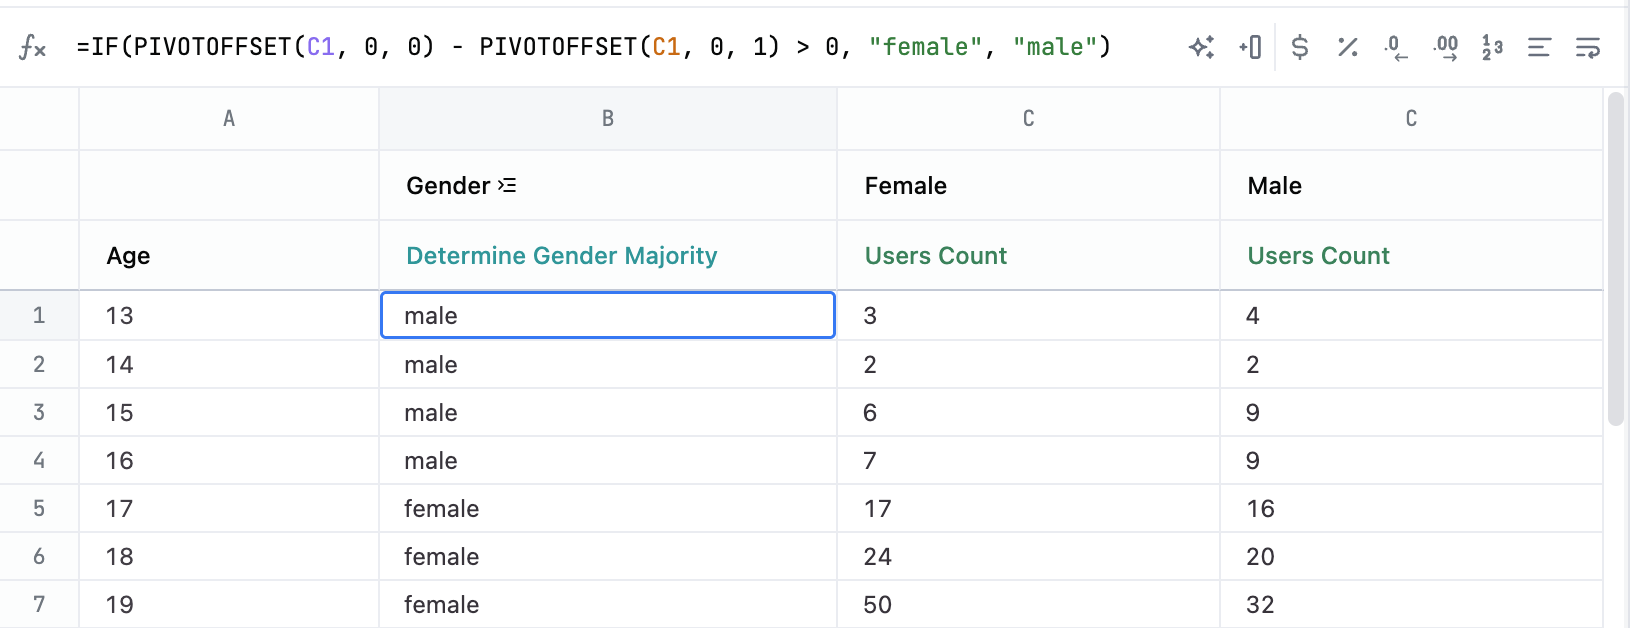
Col | Name | Description or formula | Purpose |
---|---|---|---|
A | Age | query field | determines number of hexagons to make and their labels |
B | Determine Gender Majority (calc_1 ) | =IF(PIVOTOFFSET(C1, 0, 0) - PIVOTOFFSET(C1, 0, 1) > 0, "female", "male") | more male or female calculation |
C | Users Count | query field | values to count |
Pivot | Gender | query field | breakdown |
Example code
<style>
h3 { margin-block: 0; }
h4 { margin-top: 0; color: var(--color-text1); font-size: var(--font-sm); }
.honeycomb2 {
--hc-width: 60px;
--hc-height: calc(1.1547 * var(--hc-width)); /* 1.1547 ~= 2/sqrt(3) */
--hc-gap: 8px;
/* calculate width based on # of cells you want per row
will also need to adjust the css below for offsets */
width: calc(12.5 * var(--hc-width) + 12 * var(--hc-gap));
margin: 0;
padding: 0;
list-style: none;
display: flex;
flex-wrap: wrap;
flex-direction: row;
gap: 0 var(--hc-gap);
& li {
width: var(--hc-width);
height: var(--hc-height);
margin: 0;
padding: 0;
display: flex;
background-color: var(--color-border1);
clip-path: polygon(50% 0%, 100% 25%, 100% 75%, 50% 100%, 0% 75%, 0% 25%);
display: grid;
grid-template-rows: 1fr 1fr;
margin-top: calc(var(--hc-height) / -6);
& .hex-label {
text-align: center;
font-size: 12px;
width: 100%;
}
& .hex-value {
display: flex;
flex-direction: column;
justify-content: flex-end;
align-items: center;
font-size: 16px;
font-weight: bold;
}
}
& li.female {
background-color: var(--color-critical4);
}
& li.male {
background-color: var(--color-info4);
}
/* # of cells */
& li:nth-of-type(12n + 1) {
margin-left: calc(var(--hc-width) / 2 + var(--hc-gap) / 2);
}
& li:first-of-type,
& li:nth-of-type(24n + 1) {
margin-left: 0;
}
& li:nth-of-type(-n + 12) {
margin-top: 0;
}
}
</style>
<h3>Are there more male or female shoppers?</h3>
<h4>Broken down by age of shopper</h4>
<ul class="honeycomb2">
{{#result}}
<li class="{{calc_1.value}}">
<span class="hex-value">{{users.age.value}}</span>
<span class="hex-label">{{calc_1.value}}</span>
</li>
{{/result}}
</ul>