Examples
Heatmap: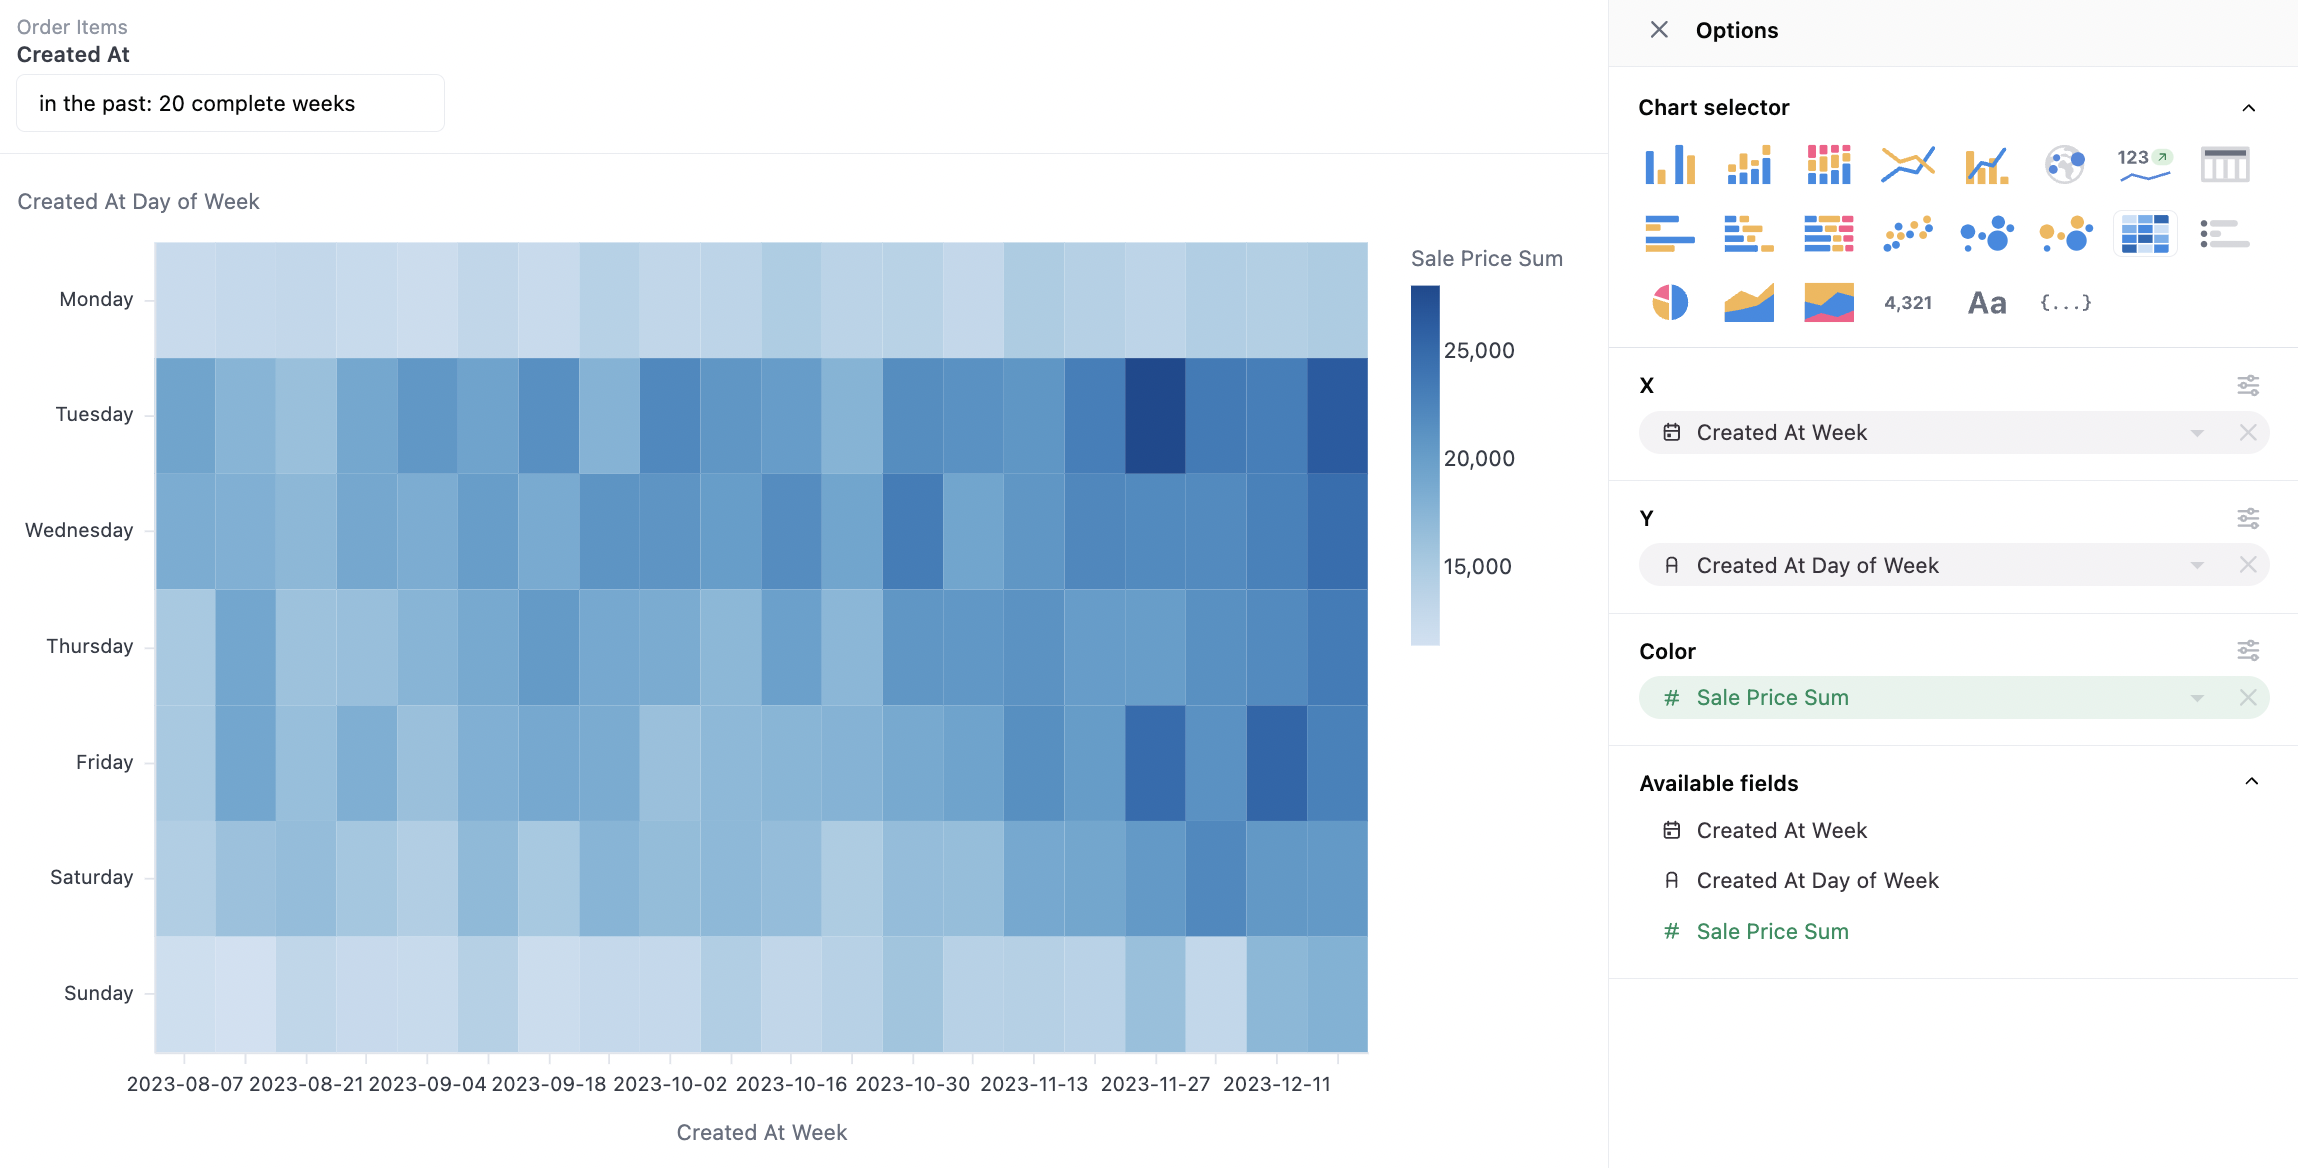
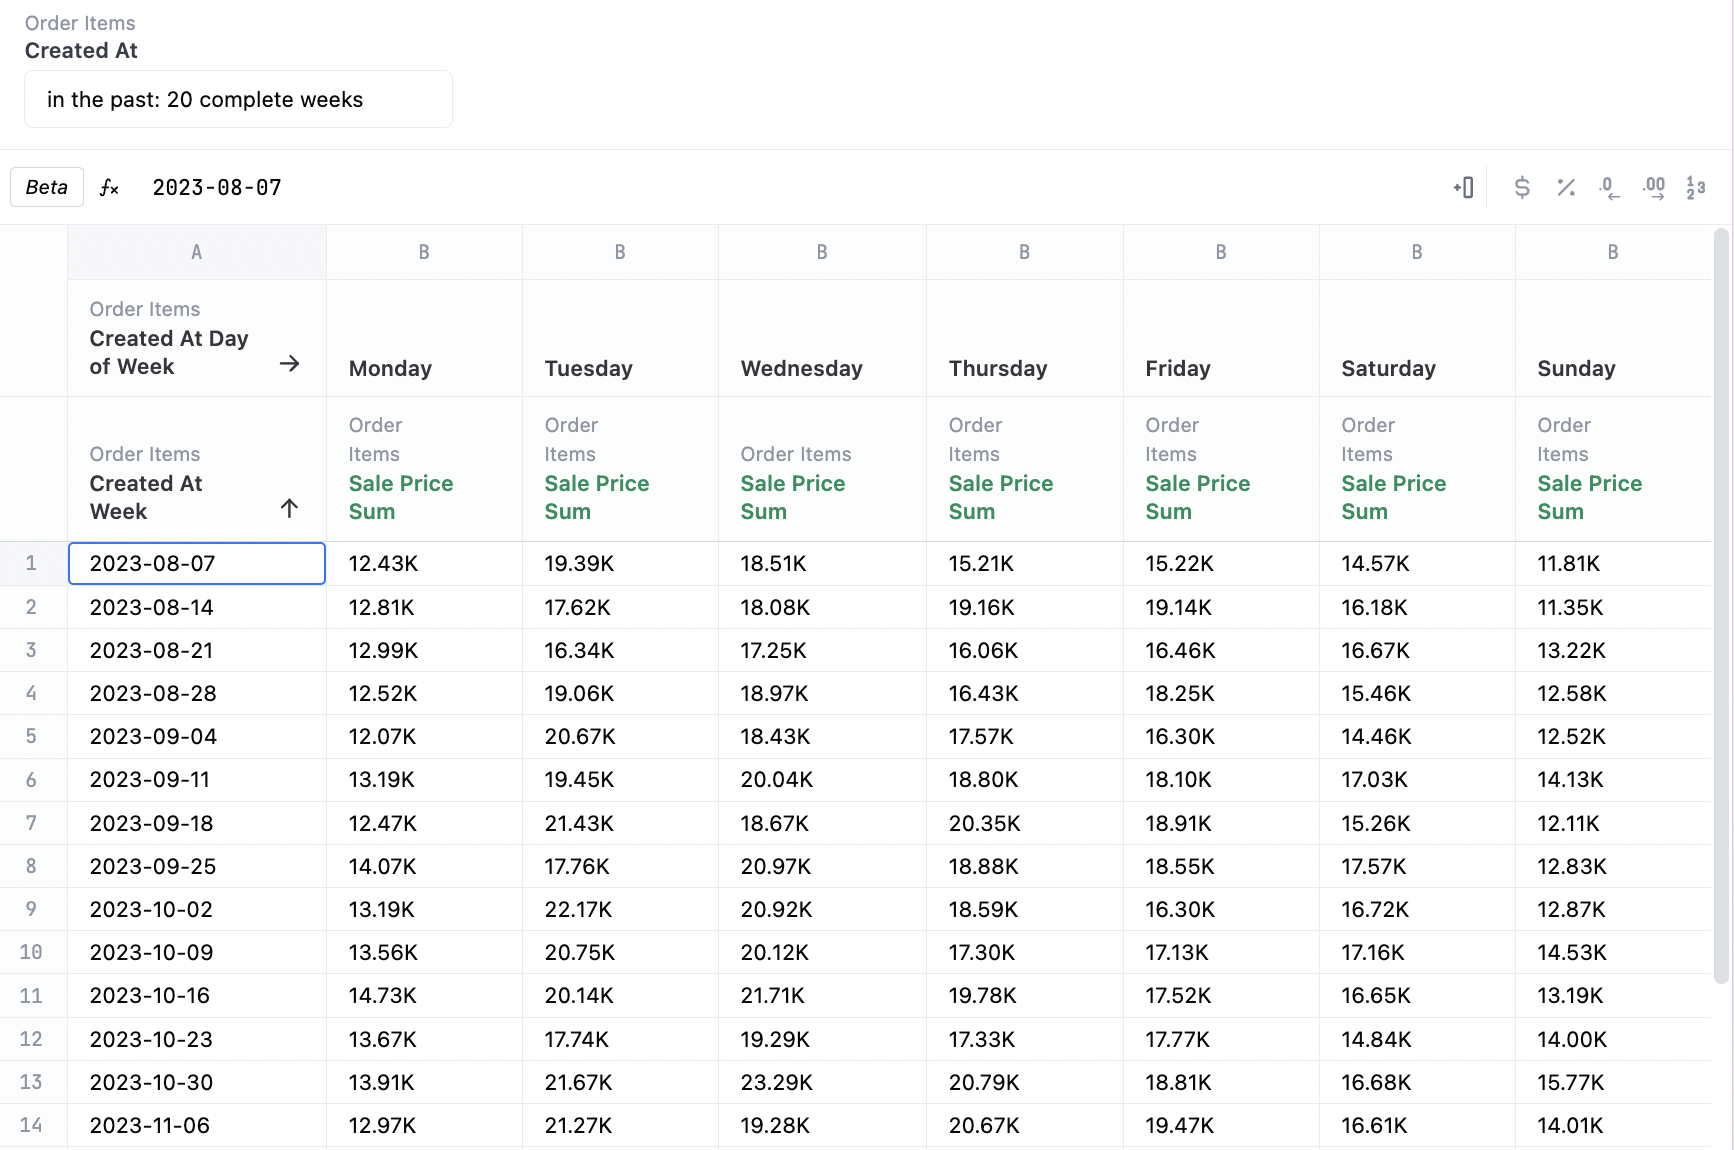
Data Structures
Heatmaps can work with pivoted or unpivoted data, using 2 dimensions and one measure, or with all dimensions where there is a numeric available for the color facet. They often use two time facets, for example:date&hour_of_dayweek&day_of_weekmonth&year